Call Cognex Sales: 855-4-COGNEX (855-426-4639)
- Contact Us
In factory automation, where speed, simplicity, and reliability are crucial, the In-Sight L38 excels, offering a fast, easy-to-use 3D inspection solution for maintaining the highest quality. With embedded AI, powerful optics, and industry-proven vision technology, the In-Sight L38 solves a range of inspection, measurement, and guidance applications.
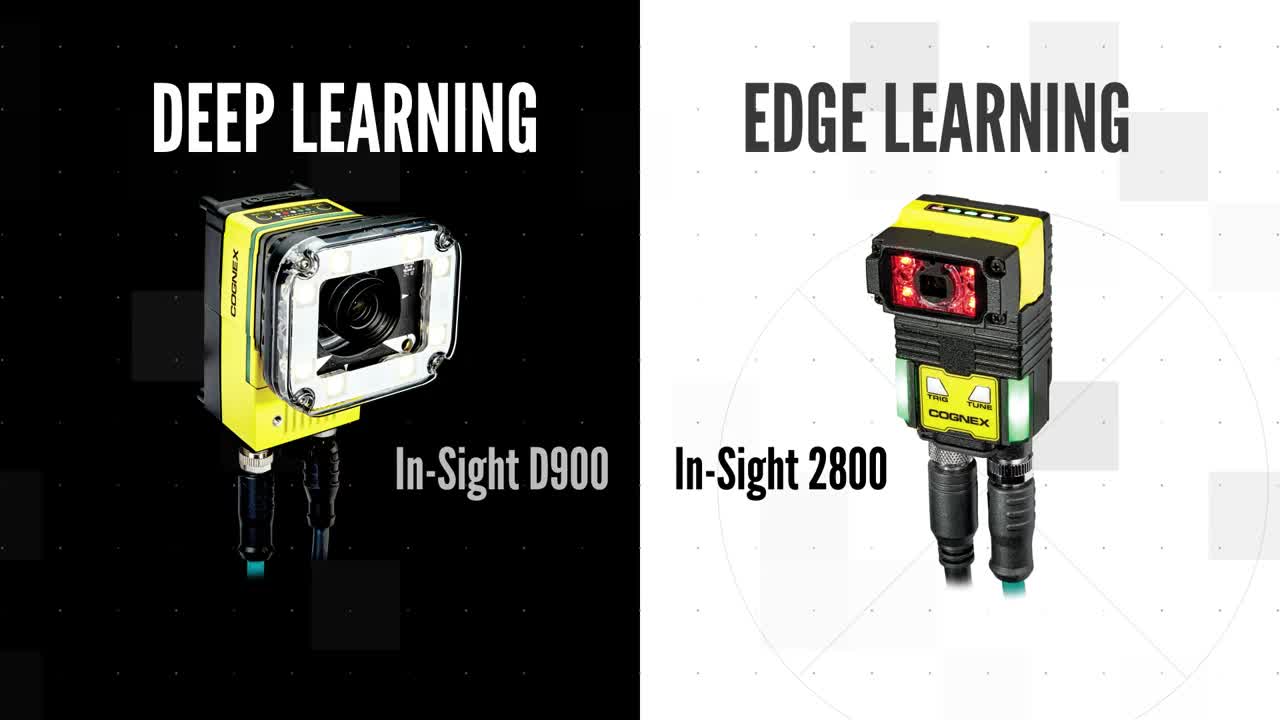
Get more from your automation with the combined power of 3D machine vision and AI.
With over a million systems sold and 40 years of experience, Cognex is the world’s leading provider of vision systems, software, sensors, and industrial barcode readers used in manufacturing automation.
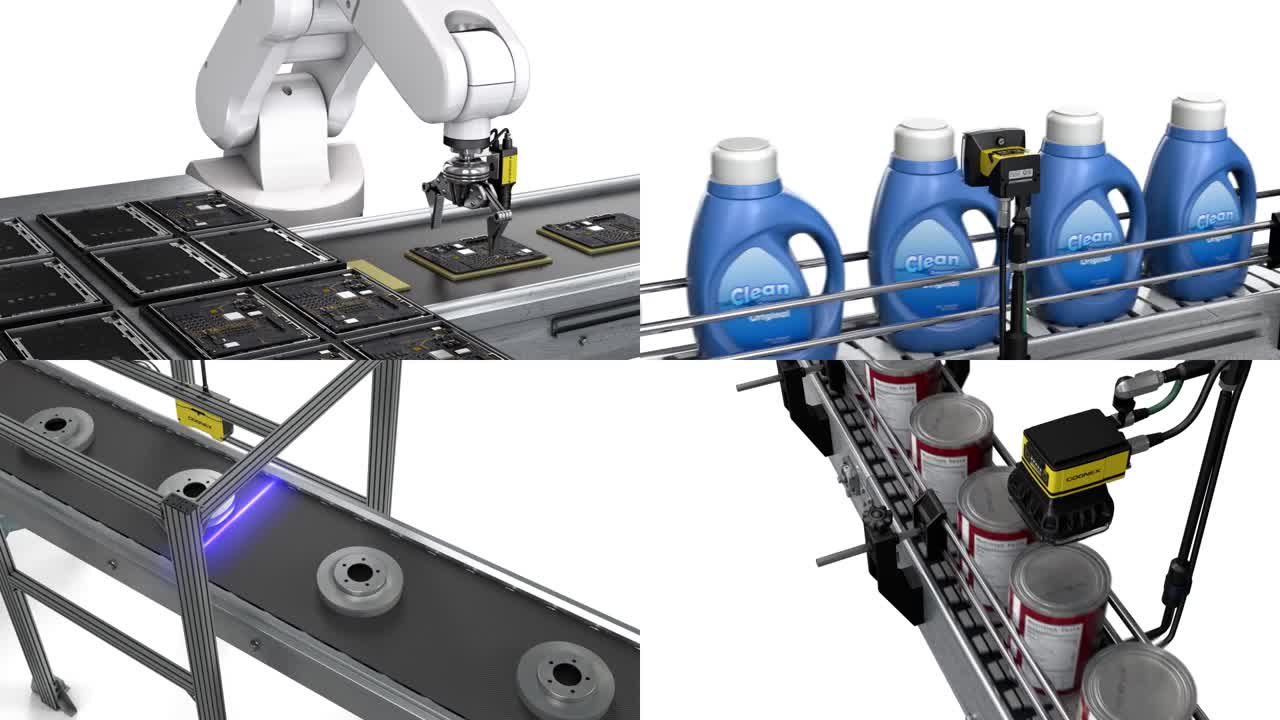
Use Cognex vision, ID, and AI-powered technologies in your manufacturing and logistic processes to improve product quality, guide assembly robots, and track items through each stage of production and distribution.
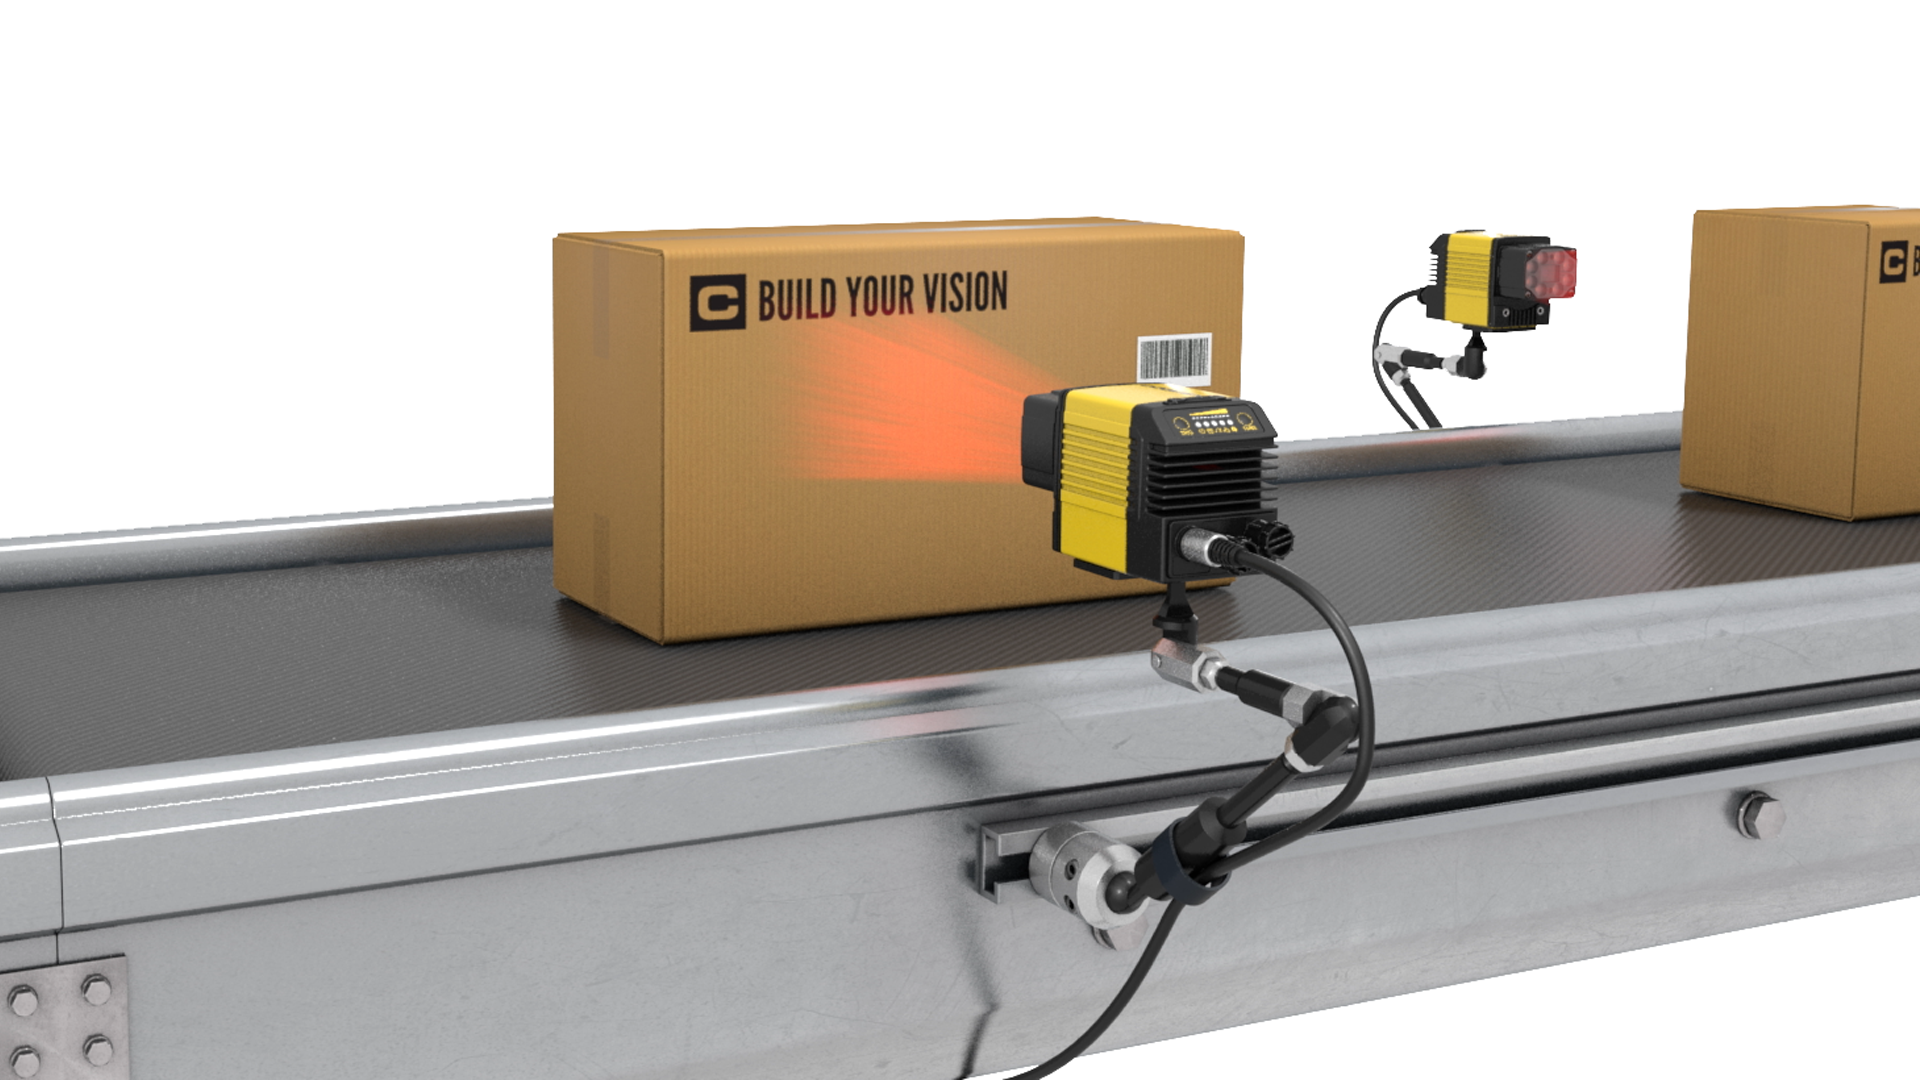
Machine Vision and Industrial Barcode Reading Products
Explore Cognex Products